Short-form chart videos
Export animated charts for social channels where pacing, framing, and immediate clarity matter.
Build charts that hold attention
Create animated charts for social, presentations, editorial publishing, and client storytelling with one chart studio built for narrative pacing.
Designed for branded data stories, video exports, interactive embeds, and presentation-ready stills.
Use one workflow to turn raw data into clear chart stories for the formats your audience already watches and reads.
Export animated charts for social channels where pacing, framing, and immediate clarity matter.
Control when each point appears so charts support the argument instead of overwhelming the slide.
Publish interactive embeds and supporting visuals for articles, reports, and data-led analysis.
Use animated data stories in sales, investor, and research conversations without rebuilding the chart for every format.
Most chart tools produce static output. Eeagli gives teams control over design, brand, timing, and distribution from the same workspace.
Start from spreadsheets or structured chart data, then keep the dataset editable as the story develops.
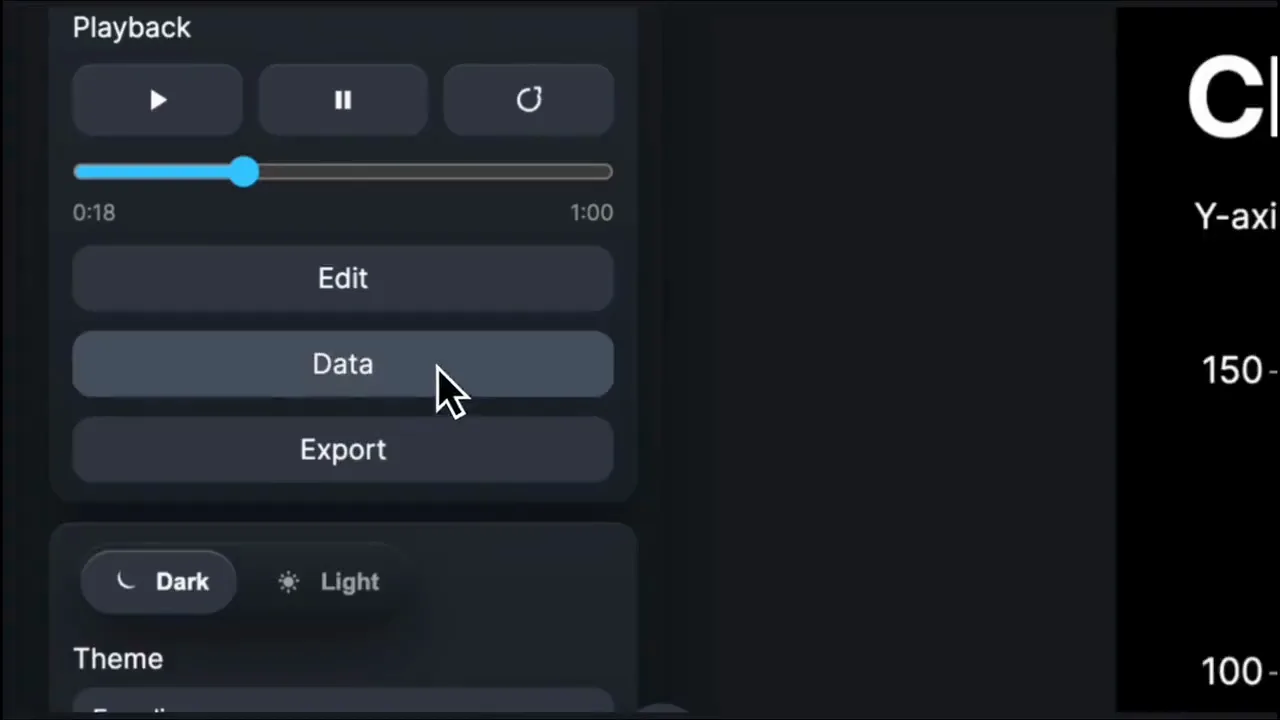
Set pacing, pauses, labels, themes, and chart behavior around the message the viewer needs to understand.
Export high-resolution video, still images, or interactive embeds for the web, social, reports, and presentations.
Move from generic static charts to branded data stories with motion, layout control, and publishing built into one workflow.