
Learn
How the best economic and financial charts are built, and why they work. Every teardown shows you how to build it in Eeagli.
-
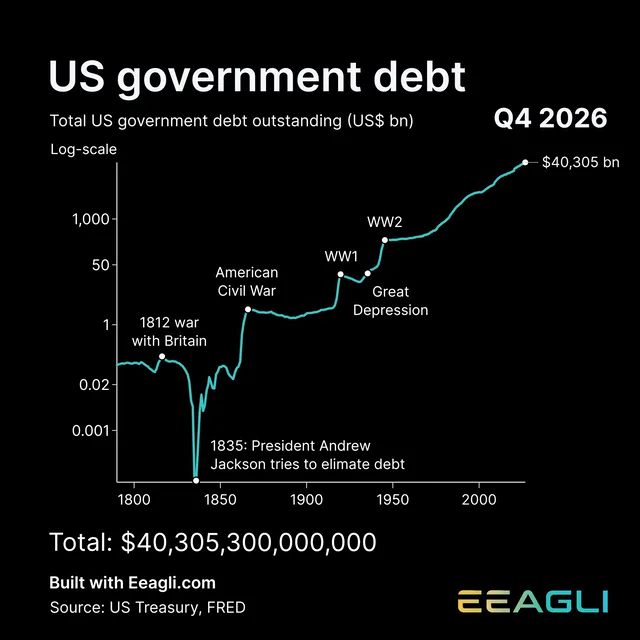
Line chart · Tutorial
How I animated $40 trillion of US debt
A step-by-step tutorial for an animated line chart with annotations, a live ticker and a log-scale finish.
-
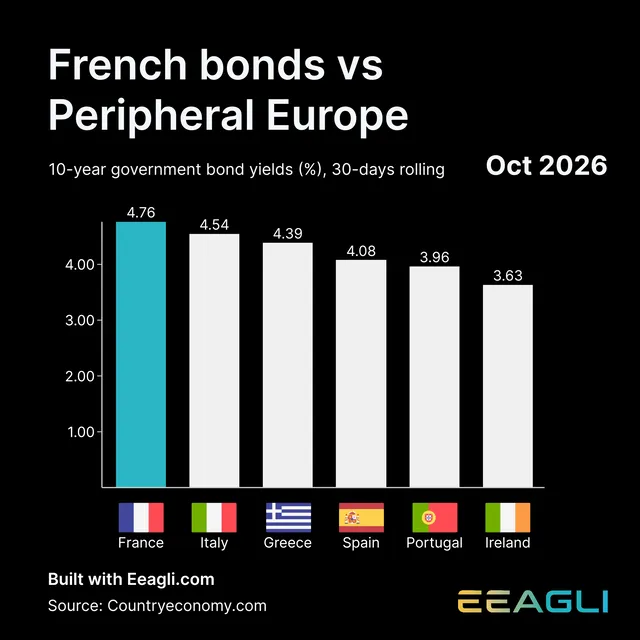
Bar chart race · Tutorial
How to build a bar chart race
A step-by-step tutorial for a bar chart race with one highlight colour and flags that move with their bars.